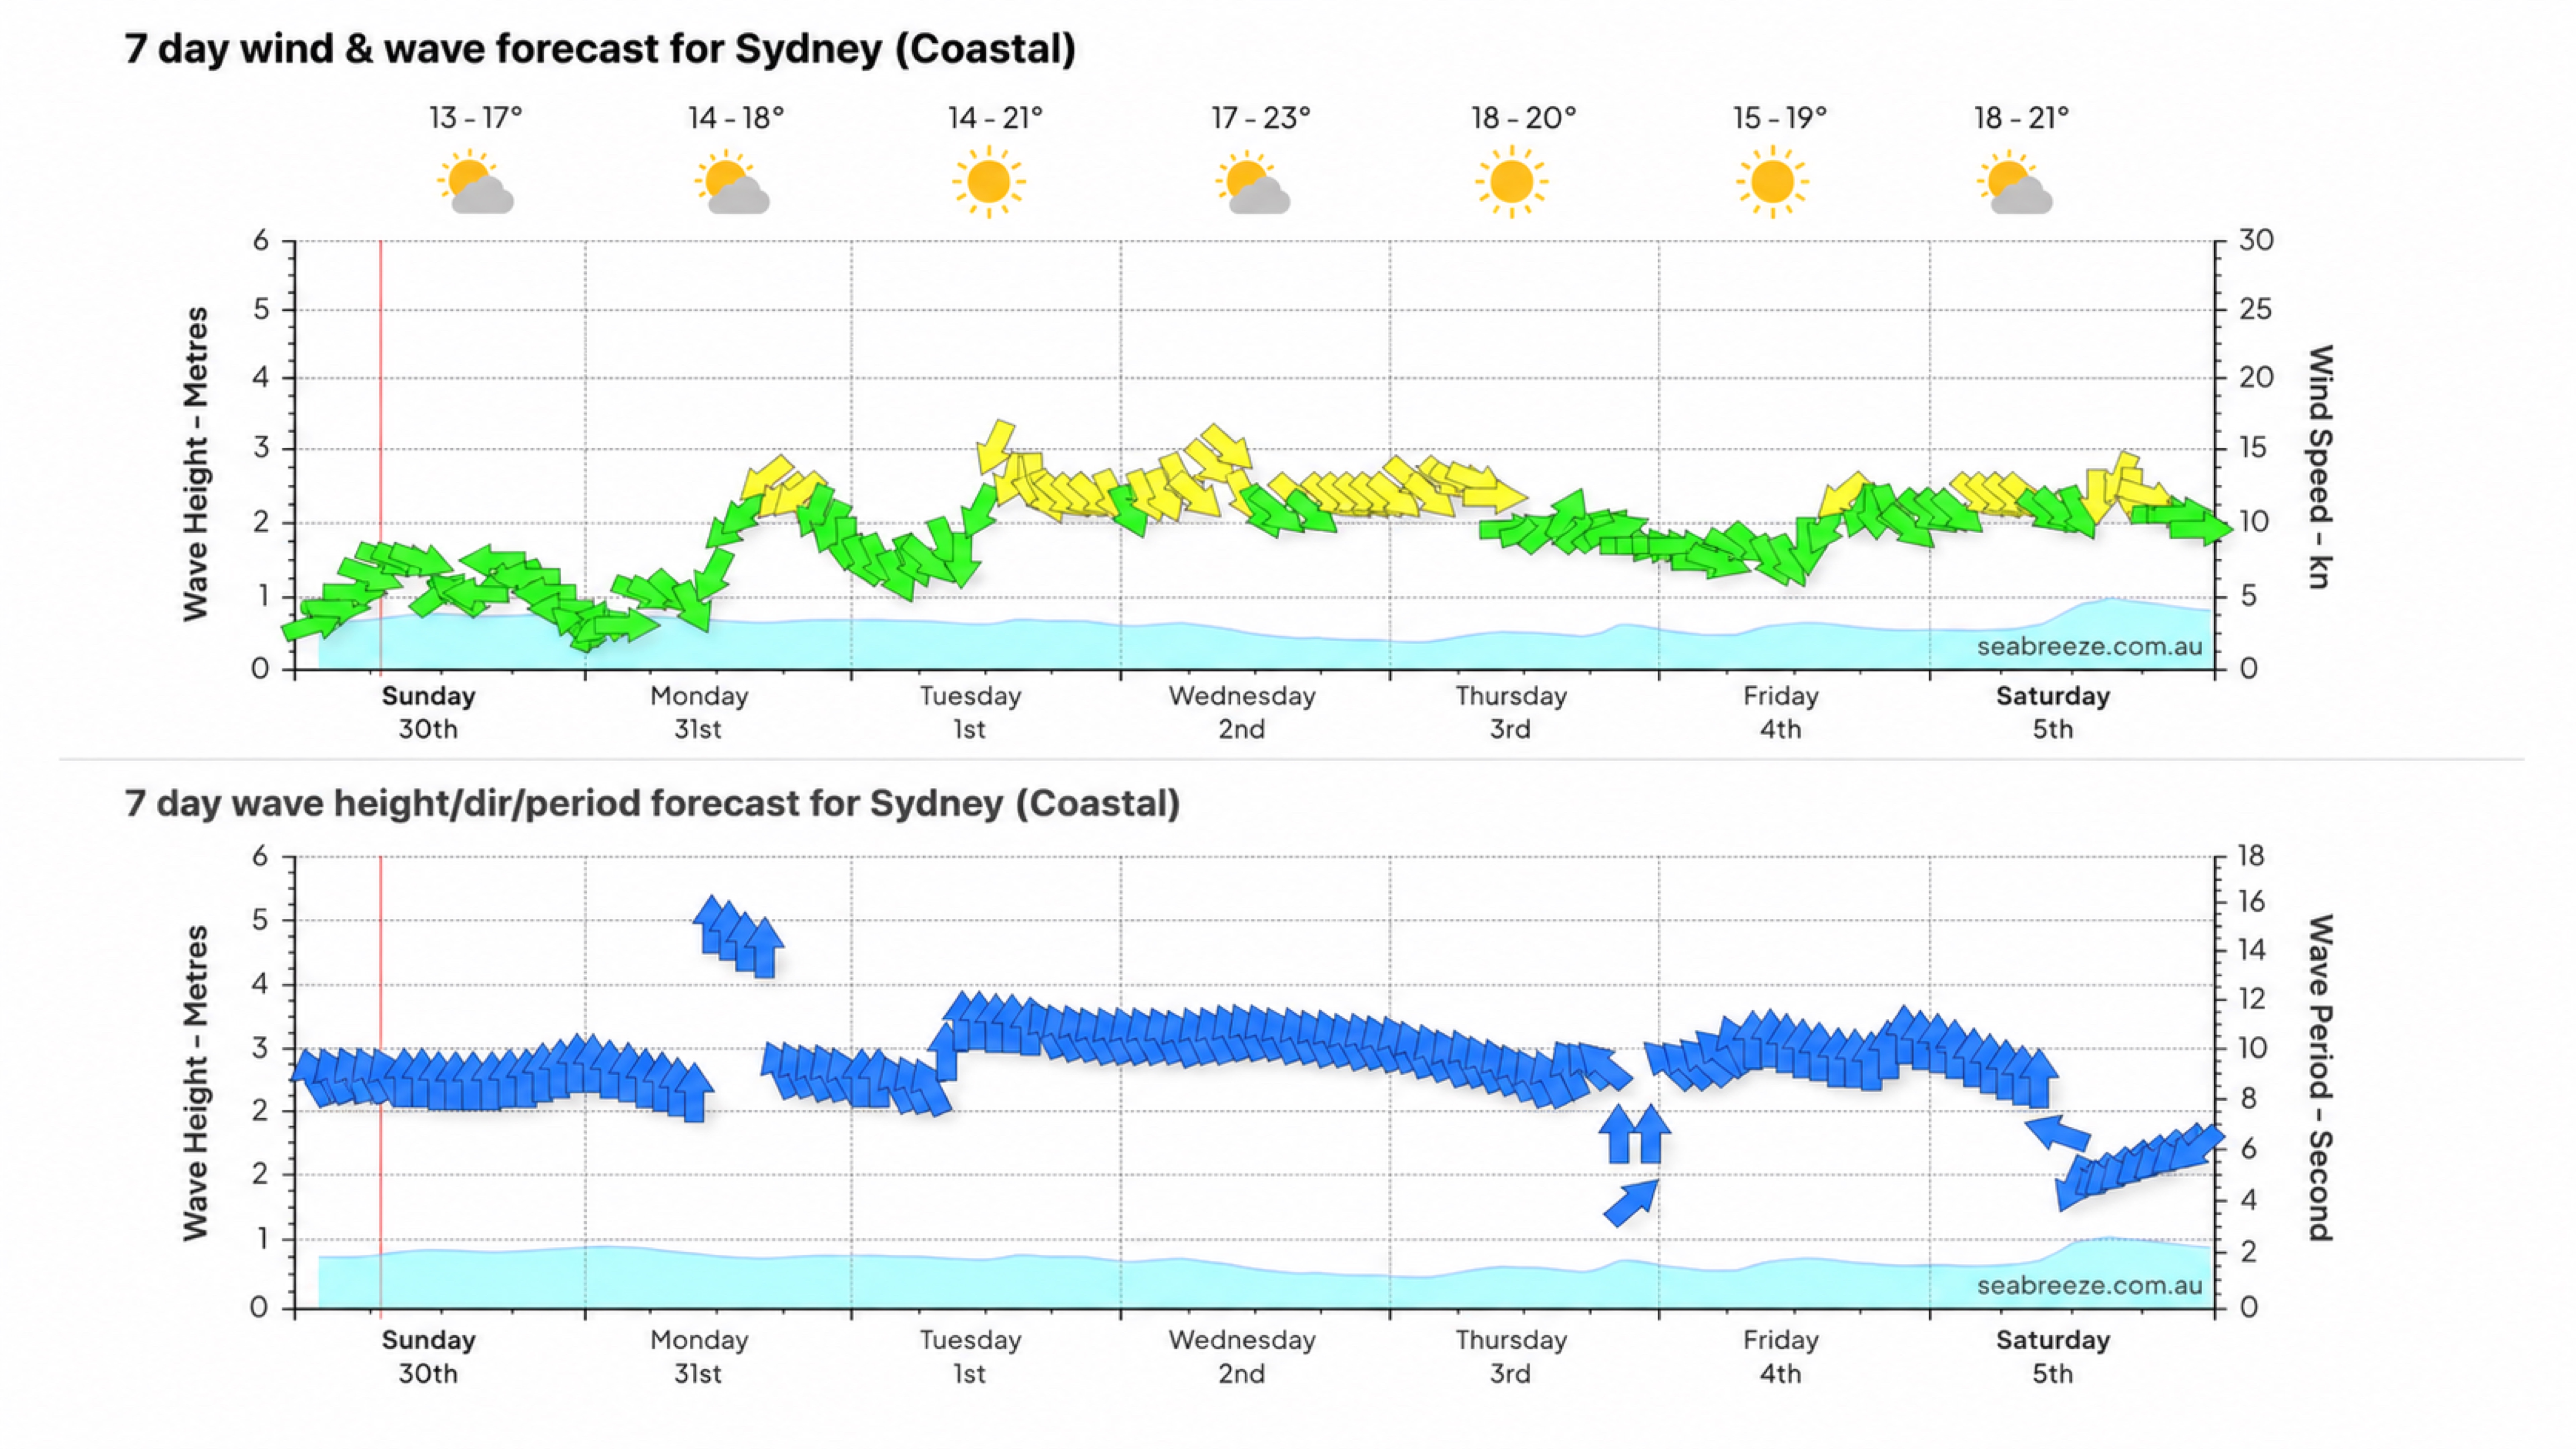
A good boating forecast is more than a wind number. For Sydney Harbour, Pittwater, Broken Bay and the Hawkesbury, the safest picture comes from reading wind, waves, tide and current together, while also checking what is expected for the trip home.
Seabreeze is excellent for seeing the trend at a glance. The Bureau of Meteorology (BOM) marine forecast and warnings are the official check. Neither replaces looking at the water, knowing your boat and setting a conservative limit before you launch.
Quick answer: Check warnings first. Then read wind direction, average speed and gusts; wave height, direction and period; tide time and height; and current direction and speed. Compare the whole picture with your boat, route, crew and return time. If one important factor is outside your limit, change the plan.
The five checks to make before every trip
- Warnings: Open the BOM marine forecast and warnings first.
- Wind: Check direction, average speed and gusts for the full trip.
- Waves: Read sea, swell height, direction and period together.
- Tide and current: Tide is water level. Current is moving water; check both.
- Your limit: Compare the forecast with the boat, route, crew and return leg.
Start with the right forecast
A forecast is only useful if it covers the water you will actually be on. Sydney’s waterways can change quickly from sheltered water to an exposed entrance.
- Sydney Harbour and Pittwater: open the BOM Sydney Enclosed Waters forecast. It covers Sydney Harbour, Pittwater and Botany Bay and includes winds, seas and weather.
- Broken Bay entrance and offshore: also open the BOM Sydney Coastal Waters forecast for Broken Bay to Port Hacking. It adds coastal sea and swell detail.
- Hawkesbury route: check warnings, the NSW tide tables and MetEye for the full route and time window. Current varies through channels and cannot be taken from tide height alone.
- Before departure: reopen the forecast, warnings and radar. A seven-day graph is a planning aid, not a substitute for the latest official information.
BoatWise rule: read every time block from launch to the planned return, not just the calmest part of the day.
How to read wind
- Direction: BOM text names wind by where it comes from. A southerly comes from the south. In the Seabreeze graphic above, the arrows point towards where the wind is travelling. Always check the legend because products can use different conventions.
- Average speed: BOM marine wind speed is a 10-minute average and is normally shown in knots. One knot equals 1.852 km/h.
- Gusts: gusts can be about 40% stronger than the forecast average, and stronger again in squalls or thunderstorms. A 20-knot average can therefore produce gusts around 28 knots.
- Exposure: an offshore wind may feel light at a sheltered ramp and strengthen away from land. Headlands, valleys and narrow channels can funnel or accelerate wind.
What do the BOM wind warnings mean?
| BOM marine warning | Average wind speed |
|---|---|
| Strong Wind Warning | 26–33 knots |
| Gale Warning | 34–47 knots |
| Storm Force Wind Warning | 48–63 knots |
| Hurricane Force Wind Warning | 64 knots or more |
A warning threshold is not a personal safe limit. A small open boat, a bar crossing or an inexperienced crew may need a no-go limit well below 26 knots. Set the limit for your boat and people before seeing the forecast.
How to read waves and swell
- Sea is the shorter, steeper chop created by local wind. Swell has travelled from weather farther away and may arrive even when local wind is light.
- Wave height, direction and period belong together. A one-metre, five-second wave train is very different from a one-metre, fourteen-second swell because the longer-period swell carries more energy.
- Significant wave height is the average height of the highest one-third of waves, not the largest wave. BOM advises that an individual wave around twice the forecast total height may occur roughly three or four times a day, about one wave in every 2,000–3,000.
- BOM text names swell by where it comes from. In the Seabreeze graphic, the arrows point towards where it travels. Check the legend before interpreting direction.
- Compare direction with the route. Swell can wrap around headlands, steepen in shallow water and combine with local wind sea near Sydney Heads, Barrenjoey and Broken Bay.
Wind against current: when wind and current move in opposite directions, waves become shorter and steeper. This can make entrances, bars, headlands and narrow channels rougher than the separate wind and wave numbers suggest.
How to read tide
- High and low labels show predicted times and water heights at the named tide station. The curve shows the predicted water level between them.
- Use a station close to the trip. Fort Denison is useful for Sydney Harbour, but tide timing and height change farther upstream and in other waterways.
- Tide height is not water depth. Only combine charted depth and predicted tide when both use compatible chart datums, and still allow for waves and weather effects.
- Actual water level can differ because of wind, air pressure, storm surge and seasonal effects.
- Most importantly, a tide graph does not show current speed. High or low water does not guarantee slack water; the weakest flow may occur earlier or later, depending on the location.
Current: direction, speed and timing
Current is moving water. It can slow the boat, increase speed over the ground, push the track sideways and steepen waves when it opposes the wind. Read four things: direction, speed, timing and location.
Four current words worth knowing
- Flood: tidal flow travelling into a harbour, river or estuary.
- Ebb: tidal flow travelling out towards the sea.
- Slack water: the short period of weakest flow while the current changes direction. It is not necessarily still water and may not occur exactly at high or low tide.
- Set and drift: set is the direction the current carries the boat; drift is the current speed.
How fast is one knot of current?
| Current speed | Same speed in other units | Simple meaning |
|---|---|---|
| 0.5 kt | 0.26 m/s • 0.93 km/h | Water travels 0.25 nautical mile in 30 minutes |
| 1.0 kt | 0.51 m/s • 1.85 km/h | Water travels 0.5 nautical mile in 30 minutes |
| 2.0 kt | 1.03 m/s • 3.70 km/h | Water travels 1 nautical mile in 30 minutes |
| 4.0 kt | 2.06 m/s • 7.41 km/h | Water travels 2 nautical miles in 30 minutes |
One knot means one nautical mile per hour. In a simplified straight-line example, a boat making 10 knots through the water would make about 9 knots over the ground into a 1-knot current, or about 11 knots with it. A cross-current changes the track. Real flow is rarely perfectly steady or uniform.
How to read a current map or live sensor
- Check the legend and timestamp. On BOM ocean-current maps, arrows point towards where the water is moving. Other apps may use different symbols.
- Read the units. One knot is 0.514 metres per second; one metre per second is about 1.94 knots.
- Know the map’s limit. BOM’s ocean model grid is roughly 10 kilometres and does not provide data in water shallower than about 15 metres. It cannot resolve channel-scale flow inside Sydney Harbour, Pittwater or the Hawkesbury.
- A live sensor describes one station at one time. It does not give the speed everywhere in the harbour or later in the trip.
- On the boat, compare heading and speed through the water with GPS course and speed over the ground. The sideways difference helps reveal set; the speed difference helps reveal drift. Wind and steering also affect the comparison.
Published local current-speed references
There is no single current speed for Sydney. The examples below are measurements or models from specific locations. Use them to understand the possible scale of local flow, not as live readings or safe operating limits.
| Area and source type | Published current speed | How to use it |
|---|---|---|
| Sydney Harbour: Manns Point measurements | Average 0.23–0.25 kt; recorded maximum 0.80–0.84 kt | A site-specific measurement. Check current conditions for your route. |
| Sydney Harbour: Berry Island measurements | Average 0.08–0.10 kt; recorded maximum 0.35–0.56 kt | Shows how much speed can differ between nearby locations. |
| Northern Pittwater: regional model applied at Palm Beach | Peak mid-channel about 0.2 m/s, or 0.39 kt | A site-specific model, not a live Pittwater reading. |
| Hawkesbury near Long and Dangar Islands: model | About 1.2 m/s, or 2.3 kt, local maximum under baseflow | A local model only. Bends, runoff and tidal phase change the actual flow. |
| Same Hawkesbury area: modelled 20% AEP flood | About 2.0–2.2 m/s, or 3.9–4.3 kt | A flood scenario, not an everyday current. Expect stronger outflow and debris after rain. |
Sydney Harbour
- As a general guide, flood flow moves inward from Sydney Heads and ebb flow moves seaward. Points, islands, bays and channels can alter the exact set.
- Use the Port Authority’s timestamped observations with the Fort Denison tide and your route. One reading does not represent every bay or channel.
Pittwater and Broken Bay
- Flood generally moves in from Broken Bay and ebb moves back towards it, but points, bays and islands change the local set.
- The Palm Beach example in the table is a site-specific model. Use it for context only, not as a live or Pittwater-wide speed.
- Near Barrenjoey and the Broken Bay entrance, check both Sydney Enclosed Waters and Sydney Coastal Waters because ocean swell and opposing current can make the water steeper.
Hawkesbury River
- Flood generally travels inland from Broken Bay; ebb returns towards the bay. The timing changes upstream, and the main channel can run faster than side creeks.
- The Brooklyn examples in the table are local model results. They show how sharply flow can increase in flood conditions, but they do not describe the whole river.
- Bends, bridges, narrow passages, tidal phase and freshwater runoff alter the flow. After heavy rain, expect stronger downstream current and debris.
Going offshore
The East Australian Current is variable and forms moving eddies. BOM notes that its core can reach about 2 metres per second, around 3.9 knots, but that is not the speed on every offshore route or day. Check the current forecast for the route, understand its shallow-water limitations, and remember that wind against current can steepen the sea.
A simple BoatWise go/no-go routine
- Choose the route and return time. Include exposed sections, entrances, bars and the trip home.
- Open the relevant BOM marine forecast and warnings. Then use Seabreeze to understand the trend and timing.
- Write down wind average and gusts, wave height and period, tide times and height, current direction and any available speed.
- Compare those conditions with a limit set for this boat, load, skipper and crew. Make the limit lower for a small boat, night trip, bar crossing or inexperienced passengers.
- Inspect the hull, hatches, bungs, seacocks, engine, steering, fuel, batteries, bilge pumps, communications and required safety equipment.
- Recheck immediately before launching. Delay or cancel for a warning, thunderstorm, flood, unsafe bar, mechanical doubt or any condition outside the written limit.
- Keep checking underway. If reality is worse than forecast, turn back early while there is still a safe option.
There is no universal safe number. A forecast manageable for a large, well-crewed vessel may be unsafe for a small open boat. The skipper’s limit must reflect the boat’s design and loading, the route, experience, passenger condition, visibility and available shelter.
Useful weather and boating services
- Seabreeze: fast seven-day wind, wave, period and tide trends. Check the legend and timestamp.
- BOM Sydney Enclosed Waters: official marine forecast for Sydney Harbour, Pittwater and Botany Bay.
- BOM Sydney Coastal Waters: official coastal forecast for Broken Bay to Port Hacking.
- BOM Weather app and bom.gov.au: warnings, radar, forecasts and current conditions; use the website for full marine products.
- Port Authority of NSW observations: timestamped Sydney Harbour wave, wind, tide and current observations.
- NSW tide tables: predicted tide times and heights for named stations, not local current speed.
Frequently asked questions
Is Seabreeze or BOM better for boating?
Use both for different jobs. Seabreeze makes the trend easy to see. BOM supplies the official marine forecast and warnings. Check BOM immediately before departure and continue monitoring conditions.
What wind speed is unsafe for boating in Sydney?
There is no universal safe speed. BOM’s Strong Wind Warning begins at 26 knots, but many small boats and less-experienced crews need a no-go limit well below that. Include gusts, route exposure, waves and the return trip.
Does high tide mean the current is slack?
No. Tide is predicted water level; current is moving water. Slack water may occur before or after high or low tide and changes by location.
How fast does the current move in Sydney Harbour?
It varies by location and tidal phase. Published site measurements used in this guide ranged from low averages near Berry Island to recorded maxima around 0.8 knots near Manns Point. These are examples, not a harbour-wide or live speed.
How fast can the Hawkesbury current run?
A Brooklyn model reported about 2.3 knots as a local baseflow maximum near Long and Dangar Islands, and about 3.9–4.3 knots in a modelled flood scenario. The actual current changes with tide, channel shape and runoff, so check present conditions.
Can I use a tide chart to calculate current speed?
Not reliably. A tide chart shows predicted water height at a station. Local current depends on the waterway shape, distance upstream, freshwater flow and the timing of the tidal wave.
Build confidence in real conditions
Forecast reading becomes much easier when you connect the screen to what the boat is doing on the water. BoatWise private training is built around your boat, your local waterways and the conditions you need to handle, from wind and current at the marina to trip planning for Sydney Harbour, Pittwater and the Hawkesbury.
Ready to build practical confidence? Explore BoatWise private boat training or browse more Boating Resources.
Related BoatWise guides
- How to Dock a Boat in Wind
- How to Anchor Your Boat Safely and Effectively
- Sydney Harbour Destination Berths
Bottom line: read wind, waves, tide and current together. Check the official warnings, understand what each graph is showing, and choose a conservative limit for your boat and crew. If one important factor is outside that limit, change the plan.
About the author
Tristian Mooney is the founder, captain and head trainer of BoatWise. He has spent 12 years working in the maritime industry across practical boat handling, vessel operations, training and luxury-vessel management.
Fact-checked and reviewed: 30 August 2026.
General education only. Forecasts, warnings, rules, bar conditions and live observations change. The skipper remains responsible for checking current official information, carrying the required safety equipment and deciding whether the trip is safe.
Fact-check sources
- Seabreeze: Sydney Coastal wind, wave and tide display
- BOM: Sydney Enclosed Waters forecast
- BOM: Sydney Coastal Waters forecast
- BOM: Marine forecast services
- BOM: MetEye for boating
- BOM: Waves and swell
- BOM: Marine wind warning thresholds
- BOM: Ocean currents
- BOM: Ocean forecast map help
- NSW Government: Checking the weather before boating
- Port Authority of NSW: live observations
- Western Harbour Tunnel EIS: hydrodynamics and water quality
- Brooklyn Estuary Processes Study
- Lower Hawkesbury Estuary Management Plan
- NSW Environment: Pittwater estuary